Numberlines and Discrete Variables
We visualize a numberline on a spreadsheet as a row or column of numbers, and we encourage students to work with numberlines of all kinds by using parameters (initial values x0 and increments Δx) to build input numberline tables.

Operations and Functions
Functions with input and output columns to transform x into f(x) using rules and explore patterns with all 4 operations and constants stored in the parameter table.
Tables: Hundreds & Times
Tables (100’s tables and multiplication) using a vertical (column) and horizontal (row) numberlines to explore addition and multiplication patterns. (Multiplication table numberlines should grow up and right to match standard graphs.)

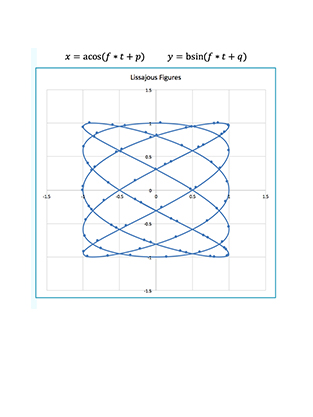
Ordered Pairs
Ordered pair tables (x, f(x)) to explore discrete variables and functions that can be displayed with line graphs, linked to tables, and changed by adjusting the parameters.
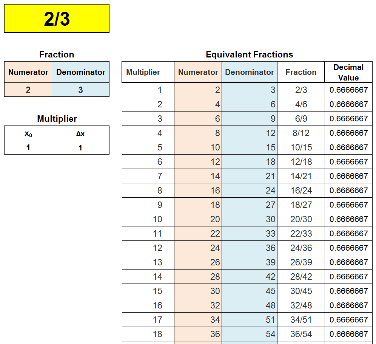
Ratio
Ratios (x, f(x)) and division tables to visualize order, conversion, and equivalence of fractions, decimals, rates, percents, interest, averages, proportions, and linear functions.
Integers
Build multiplication tables for the integers in 4 quadrants using x0 and Δx.

Inverse Variation
Use x0 and Δx to manipulate the hyperbola graphs as well as concrete tables like multiplication tables.

Classic Story Problems
Classic story problems (work problems, motion problems, mixture problems, etc.) using (x, f(x)) tables adjusting x0 and Δx parameters to find solution values or just increase accuracy.

Solving Equations
Solve equations as Judah Schwartz has taught by setting two functions equal to each other and changing the parameters to set up the functions.

Linear Functions
Linear functions with slope (m) and y-intercept (b) as parameter values along with x0 and Δx to generate discrete tables of values and graphs.

Exponential Functions
What do they look like? What happens when you change the starting value of x? What happens when you change the base (common ratio)? What does the graph look like when the base is negative?
Quadratic Functions
With (a, b, c) as parameters along with x0 and Δx in both graphs and tables. Ask questions like what does changing b do to the graph?

Families of Functions
Use the parameter table and easily adjusting and changing domains with x0 and Δx to find maxima, minima, and points of inflection.
Operations on Functions
Find inverses, absolute values using x0 and Δx to picture how the shapes of these graphs change when these parameters change.
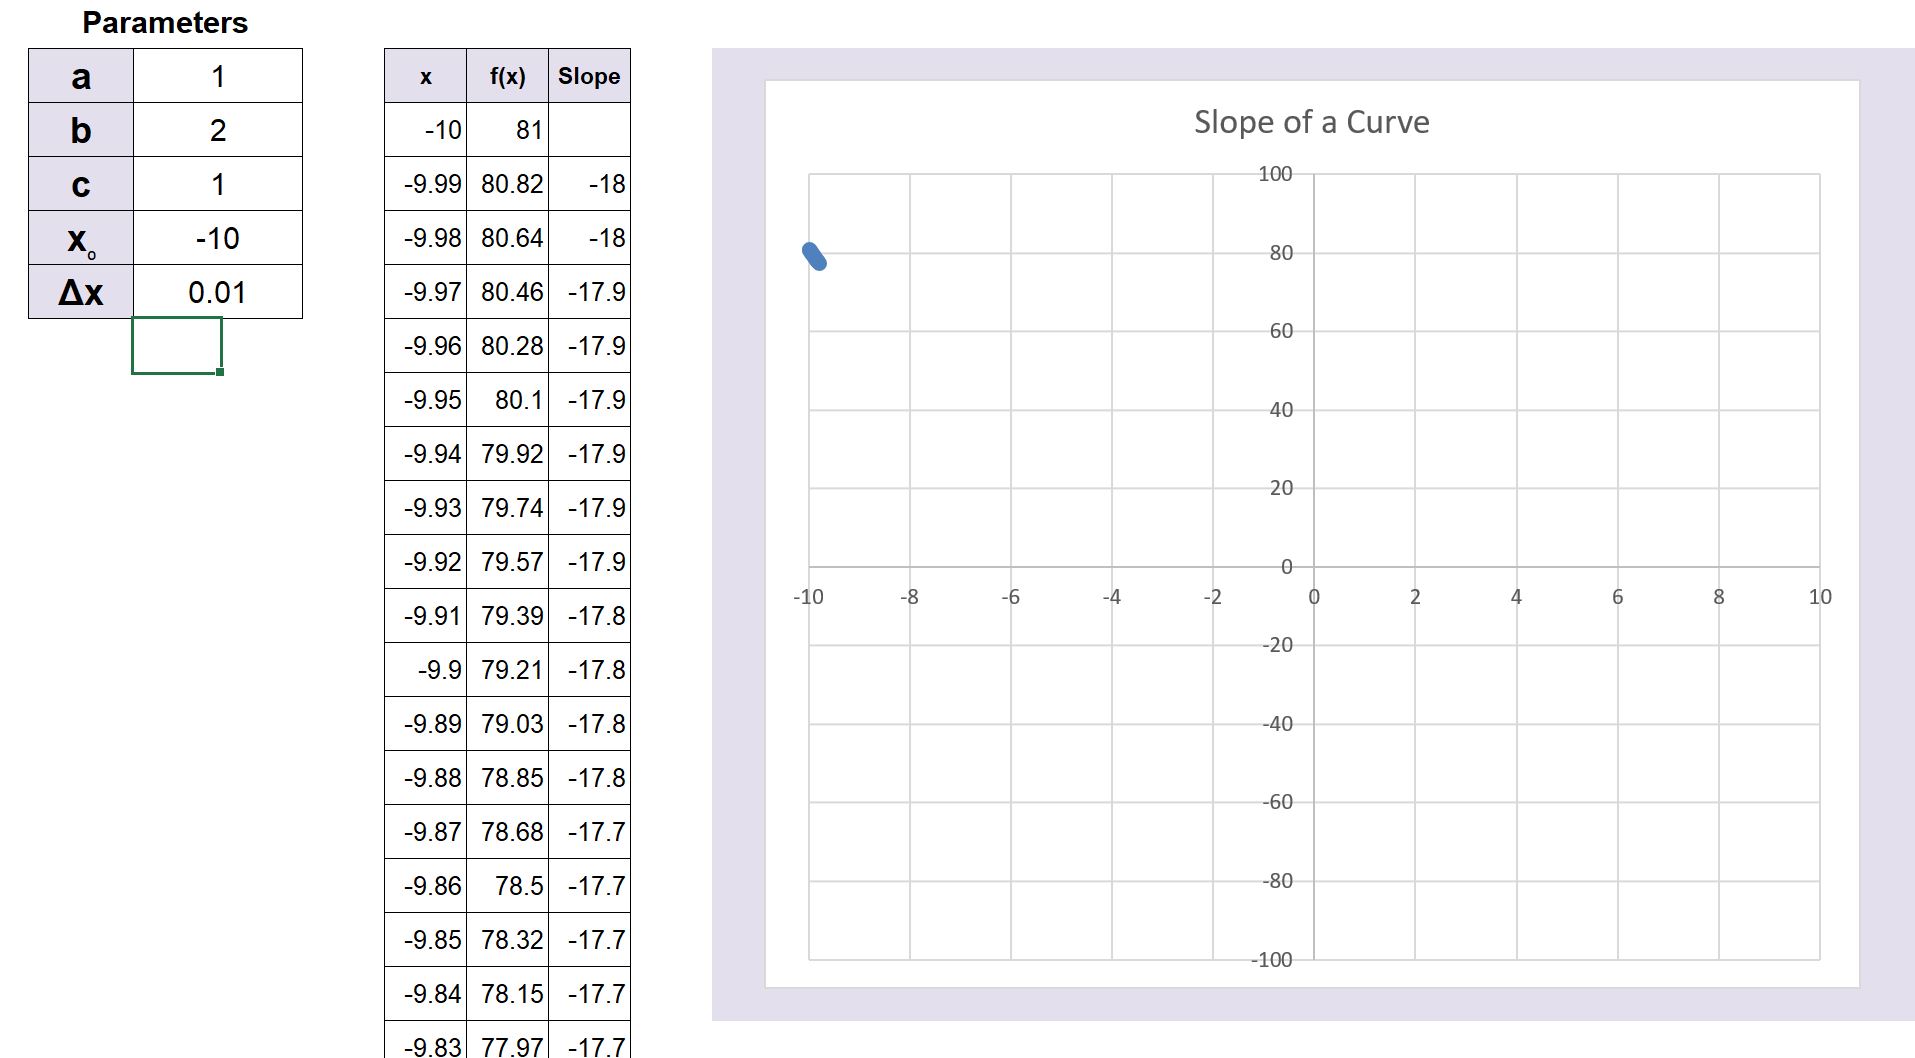
Visualizing Derivatives
Zoom into a function by shrinking Δx, at different location on a graph using x0. Students see the function becoming more and more linear to represent the slope at each point
Visualizing Integrals
Visualize integrals as Riemann sums using bar graphs and shrinking Δx.